Basics of Technical Analysis
What is technical analysis?
Technical analysis is the study of past market data to predict or follow the market trends. It can be applied to all freely traded markets around the world and the information is used to make trading or investing decisions. The market data includes price, volume, open interest (futures & options), Market breadth (stock markets), market cycle, flow of funds and investor sentiment studies etc. Technical analysts/traders do not study economic data, political developments, companies’ data or market news or events etc., as opposed to economists/ fundamental analysts; they focus on the action of the market itself than the goods in which the market deals.
How does technical analysis work?
Technical analysis assumes that prices are determined by interaction of supply and demand. Key force that drives the supply and demand is investors’ expectations which are based on human emotions (mainly fear, greed and hope). The causes of investors’ expectations are numerous which are irrelevant for a technical analyst. That brings the key rationale behind technical analysis ‘Price discounts everything’ (Discounting mechanism of markets). The technicians believe that anything that can possibly affect the price - fundamentally, politically, psychologically, or otherwise are reflected in the price of that market. So they focus on studying the chart of the price than analysing the real reason behind the move.
Next important concept in technical analysis is ‘prices move in trends’. The main objective of technical analysis is to identify and analyse the trends in multiple time frames and trading in the direction of the trends. Recognizable patterns are developed within these trends. In other words, the traders’/investors’ psychology are expressed in different patterns which have been identified and categorized over the past one hundred years of history of the markets. Technical analysis believes that History (pattern) repeats itself. Another important assumption is that the patterns are fractals in nature. That means, the similar patterns are developed in smallest to largest time frames (tick to yearly) repetitively. So technical analysts study these patterns and attempt to predict/follow the direction of trends in multiple time frames.
Concepts of trend - Types of trend
Technical analysis is nothing but analysis of trends in multiple time frames. Trend can be classified into three types; uptrend, downtrend and sideways trend. An uptrend is defined as prices makes series of successively higher peaks and troughs while the downtrend is established with a series of declining peaks and troughs. Horizontal peaks and troughs would identify a sideways trend. The concept is exhibited in Figure 1.

Figure 1 Three types of trend
The markets are always under the influence of combinations of these three types of trend in multiple timeframes. As seen in Figure 2, the currency pair EURUSD was in uptrend in daily timeframe while it had been in downtrend in weekly timeframe. Traders should focus on confirming the trend direction in the time frame in which they plan to trade.

Figure 2 Combinations of trends that exist in multiple time frames
Support and Resistance
Next important concept in trend is support and resistance and it is very important for a TA oriented traders as their risk control level (exit) is normally decided based on key support/resistance which dictates the trend direction. Therefore identification of key support and resistance levels is an essential ingredient to successful technical analysis.
As discussed in previous section, an uptrend is defined when prices make higher troughs (support) and higher peaks (resistance). A support level is the price at which buyers are expected to enter the market in sufficient numbers to take control from sellers. A resistance level is the price at which sellers are expected to enter the market in sufficient numbers to take control from buyers. For an uptrend to continue, each successive support should be higher than the one preceding it and each resistance must be higher than the one before. If the weakness in the uptrend reverse back to previous low, it may be an early warning that uptrend is ending or it may become a sideways trend, If the support is broken, it indicates that the trend has reversed from up to down. Thorough understanding of support/resistance theory is key for following the concept of trend. Another characteristic of S/R is that the support levels are once penetrated, frequently become resistance and vice versa. They reverse their roles as shown in Fig 3.

Figure 3 Real time example for the theory of Support and Resistance
The strength of support/resistance gives significant importance to the S/R which can be decided by the following factors
- The number of times that the level has been respected;
- The amount of volume that has been traded near the level;
- Whether the level is old or new - recent levels have greater significance;
- Whether the level is a new High or new Low - more extreme levels have greater impact; or
- A level formed at a round number (e.g. $1.000, $1.5000 or $2.000) has more effect.
Trendlines
The oldest and easiest method of determining the trend of prices is with a "trend line". Trend lines can be drawn with just a ruler and the use of one's eyes. All that is needed is two/three support reversal points to draw an uptrend or two/three resistance reversal points to draw a downtrend. A simple line which is drawn between the reversal points, as shown in Figure 4 & 5, identifies the trend continuation and reversal clearly.

Figure 4 Simple trendline break confirmed the reversal of NZDJPY’s 8 year uptrend

Figure 5 Trendline break may signal pause in the trend and enter into sideways trend
General rules to be applied for trendline studies are
- If a trendline is drawn joining two points, it should be considered as a tentative trendline. When it is touched for the third time, it will become a valid trendline.
- A trendline break need not turn to trend reversal; it could lead to pause in trend or consolidation.
- The longer and more times the drawn trendline are touched by prices, the more significant it is when the line is broken.
- The slope of a trendline is also one of the important criteria. 45 degree slope is considered to be ideal for a stable and sustainable trend. If slope is too steep, the trend is unsustainable for longer time. The trend is too weak if the slope is flat.
- Similar to support and resistance, the trendlines also reverse their role once it is broken. If an uptrend line is broken, it will become resistance line and vice versa.
Trend Channels
Trend channels are another variation of trendline concept. The prices trend between two parallel lines – base line and channel/return line (See Figure 6). Baseline is similar to uptrend line/ downtrend line and the channel/return line is the parallel projection of the trendline which may be used as short term profit taking area. The break of channel line signals acceleration of trend; sometimes it may end up in exhaustion of trend.

Figure 6 EURJPY had been trapped in a monthly downtrend channel from 1982 -2005

Figure 7 The break of gold’s uptrend channel was followed by multimonth consolidation
Chart Price Patterns
Chart price Patterns are one of the oldest and most widely used technical analysis tools. Price patterns are repetitive formations appear in price charts which can be classified to different categories which have predictive value (measuring implications). Once a formation completes with a breakout, price targets can be projected from the breakout price. Generally, the target is calculated by taking the height of the pattern and adding it to the breakout price. Most technicians do not give much importance to the targets as they focus on being on the right side of the trend and wish only to ride that trend. There are two main groups of patterns: trend reversal and trend continuation patterns.
Trend Reversal Patterns
As the name implies, trend reversal patterns are the patterns which reverse the established trends. The patterns form both top (reverse uptrend) and bottom (reverse downtrend). General points that are applicable for all reversal patterns are:
- An established trend must exist to reverse;
- First signal of an impending trend reversal is breakout of an important trendline support/resistance;
- The larger the pattern, the greater the subsequent move;
- Topping patterns are usually shorter in duration and more volatile than bottoms;
- Bottoms usually have smaller price ranges and take longer to build;
- Volume is usually more important for bottom formation.
With these underlying principles, let us explore important and commonly occurring trend reversal patterns. Major trend reversal patterns are
- Head and Shoulders (Top formation) & Inverted Head and Shoulders (Bottom formation)
- Triple Tops & Triple Bottoms
- Double Tops & Double Bottoms
- Triangles
- Diamond Top
- Wedges
- Rounding (saucer) Bottom & Cup and Handle Bottom
Head and Shoulders Top & Inverted Head and Shoulders Bottom
The head and shoulders pattern is probably the most famous and reliable technical pattern. The head and shoulders top pattern is a series of three well-defined peaks with the second peak higher than the first and third peak. As seen from Figure 8, the market makes the first peak (Left shoulder) and corrects to neckline and then rally to make a higher peak (Head) and correct back to neckline and makes a lower peak (Right shoulder) in its final rally attempt. The pattern is confirmed to be complete when the market breaks the neckline. In simple logic, the supply (Bears) and demand (Bulls) are balanced at the neckline. The first sign of bull’s weakness is signalled when the market makes lower peak at the right and the break of neckline confirms the start of bear trend.
Volume plays a key role in the development of H&S top pattern. Normally, the rally to head and right shoulder are made with lighter volume than the left shoulder and head respectively. Sometimes, market allow for the retest of neckline after breaking the neckline. While using the pattern, traders normally look for selling opportunity at the right shoulder formation and at the break of neckline. Low risk selling opportunity would be offered if retest of neckline takes place. An approximate target for the new downtrend could be obtained by measuring the distance from the top of the head to the neckline and projecting this down from the neckline. As discussed earlier, targets should be treated as guide posts and trends tend to move well beyond the targets.

Figure 8 Resolution of Head and Shoulders pattern was followed by a mini crash in Emini S&P during Aug’11
Inverse head & shoulder pattern is mirror image of head & shoulder pattern and it is a bottom formation. The important difference between the top and bottom patterns is volume. Volume plays more critical role in inverse head and shoulder pattern and there should be considerable increase in buying volume when new uptrend starts.

Figure 9 NZDJPY made a major bottom in 2001 with Inverse Head and Shoulders pattern. It should be noted that the pair’s uptrend had run well beyond the pattern target
Triple Tops & Triple Bottoms
Triple tops and bottoms are bit rarer in occurrence and it is slightly different from H&S and inverse H&S patterns. The three peaks/ troughs are at about the same level as opposed to H&S pattern. Most of the points discussed in H&S section are valid for this pattern also. The pattern is completed when the price breaks the neckline. Volume considerations and target calculations are similar to H&S pattern. Traders may take position on third test of the top/bottom or after the break of neckline or on the retest of the neckline.
e critical role in inverse head and shoulder pattern and there should be considerable increase in buying volume when new uptrend starts.

Figure 10 AUDJPY took almost a year to form a triple top pattern and the resolution of the pattern led to a crash in 2008.
Double Tops & Double Bottoms
Double tops and bottoms formations are the simplest of the chart patterns and easy to identify. It is also one of the least reliable and least profitable patterns. They are commonly known as ‘M’ tops & ‘W’ bottoms and greatly overused. A double top consists of three reversal points: two tops (slightly above or below the same level) almost separated by a trough and to complete the pattern, the price must break below the trough on closing basis (see Figure 11). Volume is usually lighter while forming the second top and the target price is calculated by projecting the height of the pattern to the trough level.
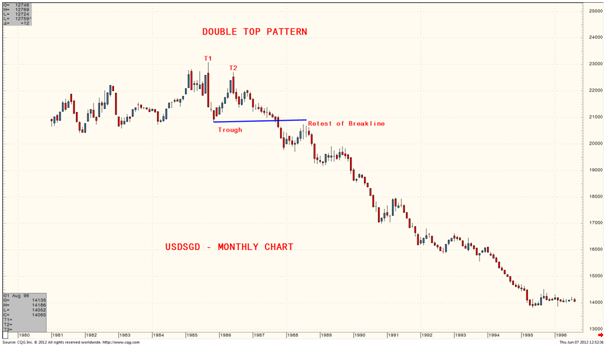
Figure 11 USDSGD’s major top was formed by double top pattern in 1985-1987.
A double bottom pattern has the same characteristics as the top but is upside down (see Figure 12) and volume must rise during breakout. Due considerations must be given to the time between two tops/bottoms. Reliable double tops & bottoms should have at least a month between two tops/bottoms.

Figure 12 EURUSD took almost 2 years to form a major low with double bottom pattern in 2000-2002.
Triangles
Triangles are formed as reversal patterns as well as continuation patterns. A triangle is formed in a range with upper and lower boundary lines converge on the right. A break out of the triangle boundary signals the reversal of the trend as shown in Figure 13. The target is derived by projecting the height of the triangle at the base to the left to the breakpoint. Let us deal triangles more in detail in continuation patterns section.

Figure 13 USDCAD’s 2009 top was formed in an ascending triangle top pattern.
Diamond Top
One of the less frequent but very profitable patterns is the diamond top (see Figure 14). It consists of a combination of a broadening pattern and a symmetrical triangle and usually occurs at the top of a very sharp upward rise in prices. It is rare at price bottoms.

Figure 14 EURJPY corrected its sharp uptrend by forming a diamond top.
Wedges
A wedge pattern is a triangle pattern with both trend lines heading in the same direction. A rising wedge has both lines headed upward, with the lower bound rising more quickly than the upper bound. The declining wedge has both lines headed downward, with the upward bound falling more quickly than the lower bound (See Figure 15). The lines converge in the right, just as in a standard triangle. Wedges are like triangles, can be the continuation patterns as well as reversal patterns. If the wedge formed after prolonged trend, the reversal is likely to be dramatic. Elliot wave analysts call wedge as ‘ending diagonal fifth wave’ to complete an Elliot wave cycle.

Figure 15 EURJPY made a dramatic reversal in Nov’00 after forming a falling wedge pattern.
Rounding (Saucer) Bottom & Cup and Handle Bottom
Reversal patterns sometimes take the shape of saucers or rounding bottoms. A rounding bottom implies slow and gradual turn from down to sideways to up (gradual accumulation by bulls). Rounding takes times with many ups and downs and sometimes it is difficult to spot breakout level. Its variation cup and handle pattern provides precise entry level as shown in Figure 16. The formations show are a variation of the rounding bottom that show a small congestion area/ pull back after the rise from the bottom which is called as handle. The high of the handle is the resistance level to watch for an upward breakout. Rounding tops are quite rare patterns compared to bottoms.

Figure 16 AUDUSD made a major bottom in 2002 by forming a Cup and Handle pattern.
Trend Continuation Patterns
Trend continuation patterns are the group of sideways price action patterns that develop during pausing period of the prevailing trend. Once the patterns are completed, the existing trend will continue in the same direction as opposed to reversal patterns. These patterns also take much lesser time duration than reversal patterns. Major common trend continuation patterns are
- Triangles
- Rectangles
- Wedges
- Head and Shoulders & Inverse Head and Shoulders
Triangles
Triangles as continuation patterns are formed when supply and demand match after a strong trend. Triangles are defined by two converging lines/boundaries. The upper line connects two or more peaks while the lower line connects two or more troughs. Triangles are classified into three types based on their shape. They are symmetrical triangles, ascending triangles and descending triangles.
The symmetrical triangle (popularly known as coil) has two converging trendlines; one is ascending and another is descending as shown in Figure 17. The target is derived by projecting height of triangle (widest part measured at the left side) from the breakout point.
Normally, volume tends to diminish during the formation of triangle and increase while breaking out. The increase in volume is essential for bullish breakout but not necessary for bearish resolution (price can fall on their own weight). Trend traders look to initiate positions on the break of triangle resistance/support line.

Figure 17 AUDUSD’s multimonth trend continuation pattern was developed in a symmetrical triangle.
In an ascending triangle, the upper trendline is relatively flat while lower trendline has rising slope as shown in Figure 18. With the rising lower trendline, the ascending triangle gives more edge to bulls.

Figure 18 USDCAD formed a multimonth bullish ascending triangle pattern during 2008.
Descending triangles are mirror image of ascending triangles with descending upper trendline and flat lower trendline as shown in Figure 19.

Figure 19 USDCHF had continued its sharp downtrend with a 4 month descending triangle pattern during 2002.
Rectangles
In the rectangle continuation pattern, the trading/consolidation range is confined by two parallel horizontal lines. A break above the upper/lower boundary line signals the trend resumption as shown in Figure 20. Target is derived by projecting the height of the trading range from the breakline.

Figure 20 USDCHF formed 2 month bearish rectangle continuation pattern during 2011 and the breakline was retested twice.
Wedges
As discussed earlier, wedge pattern is similar to triangle with converging trendlines but it has noticeable slant against the existing trend as seen from Figure 21. So a falling wedge forms in a bull trend and rising wedge forms in a bear trend.
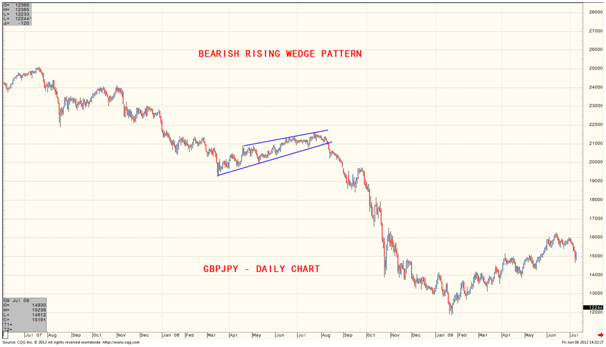
Figure 21 GBPJPY formed a bearish rising wedge pattern in the middle 2007-2009 bear trend.
Head and Shoulders & Inverse Head and Shoulders continuation patterns
We have discussed about H&S pattern in detail in trend reversal patterns section. The H&S and inverse H&S patterns can also occur as a trend continuation patterns. An example is shown in Figure 22.

Figure 22 Resolution of an H&S continuation pattern resulted in sharp sell off during 2001 bear trend.
Minor Trend Continuation Price Patterns
Minor trend continuation patterns are similar to trend continuation patterns but their duration is small; not more than 3 weeks. They develop as a pause after dynamic trends. The patterns falls under this category are Flags, Pennants and Wedges and they appear in daily and hourly charts. These are quite common patterns which are reliable. After the completion of the patterns, markets tend to move in the original direction. Trader must use these patterns to create position in the direction of the main trend.
A Flag pattern looks like a flag on the chart. It is formed with two parallel lines (either straight or sloping against the trend) as shown in Figure 23. Volume normally decline during the formation and the break of flag trend line signals the resumption of original trend.

Figure 23 NZDUSD had formed two flag patterns during 2009 uptrend. These consolidations offered nice opportunities to ride the uptrend.
Pennants are similar to flags but they are formed with two converging trendlines. Pennants are nothing but very small triangles as shown in Figure 24. We have discussed about wedges in earlier sections. The pattern can also occur as a minor trend continuation pattern as shown in Figure 24.

Figure 24 USDSGD had formed two pennant patterns during 2010 downtrend.

Figure 25 NZDJPY had formed a 3 week bearish rising wedge as a minor trend continuation pattern.
Technical analysis is a vast and ever expanding field of study. We have covered a brief introduction to the field to provide a launching pad for your research. There are many more methods/studies like moving averages, Indicators, Elliot wave, Intermarket analysis, Sentiment studies, Cycles, Gann method, Candlestick studies and Point and Figure charting etc. We encourage our customers to explore further to enrich their trading tools and look for educational webinars to be provided by our educational/research partners. We wish you Good Luck in your trading
Recommended Books for Further Reading:
1. Technical Analysis – The Complete Resource for Financial Market Technicians By Kirkpatrick, Charles D. and Dahlquist, Julie R.
2. Technical Analysis of the Financial Markets By John J. Murphy
3. Technical Analysis Explained By Martin J Pring